What every HOT 2 signal means
HOT 2 is a scanner plus a matching thinkorswim toolkit. The scanner finds the stocks that are breaking out; the toolkit draws the same lines on your own chart. Instead of spending months learning what to watch, each signal below is broken down the same way: what it is, what to look for, what sometimes happens, and what can go wrong. The scanner rows are real alerts; the small charts are drawings of what the signal looks like.
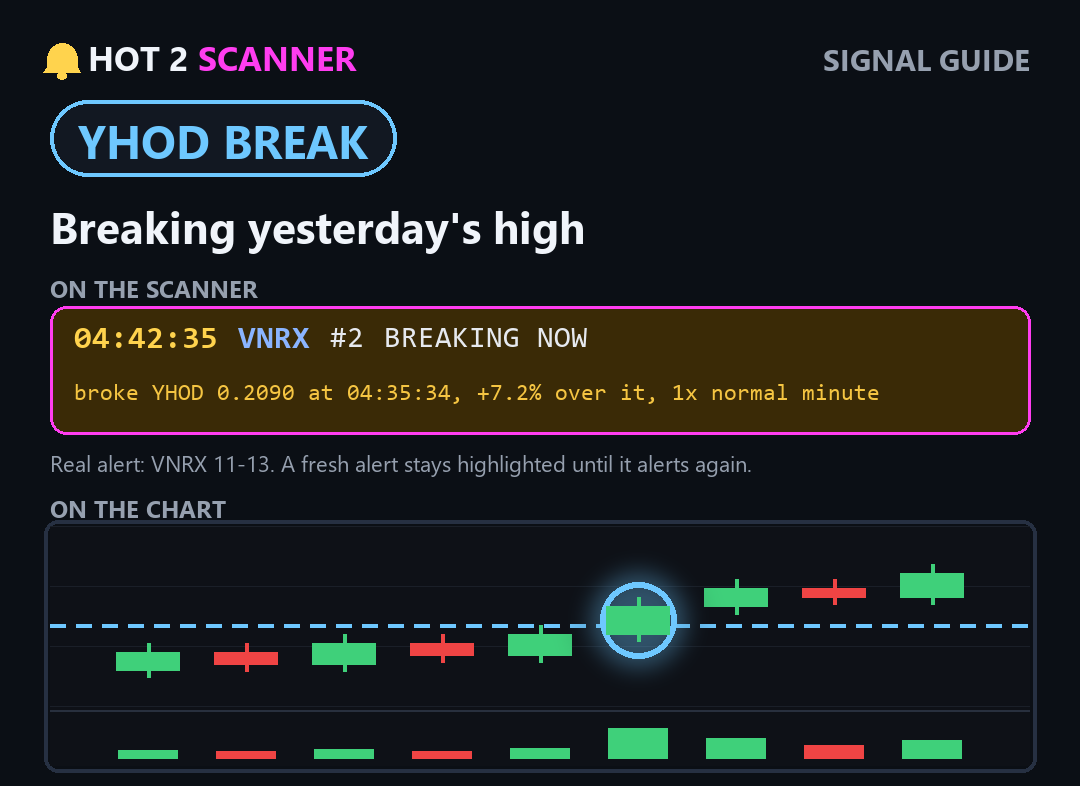
YHOD break
Breaking yesterday's high
- WHAT IT IS
- Price goes above YHOD (blue): yesterday's highest price, premarket and after-hours included.
- WHAT TO LOOK FOR
- A close above the blue line with volume many times a normal minute.
- WHAT SOMETIMES HAPPENS
- The blue line turns into a floor. VNRX later reached about $0.2757 that morning.
- WHAT CAN GO WRONG
- It pokes above the line and closes back under it: a fakeout.
- REAL EXAMPLE
- Real alert: VNRX 11-13. A fresh alert stays highlighted until it alerts again.
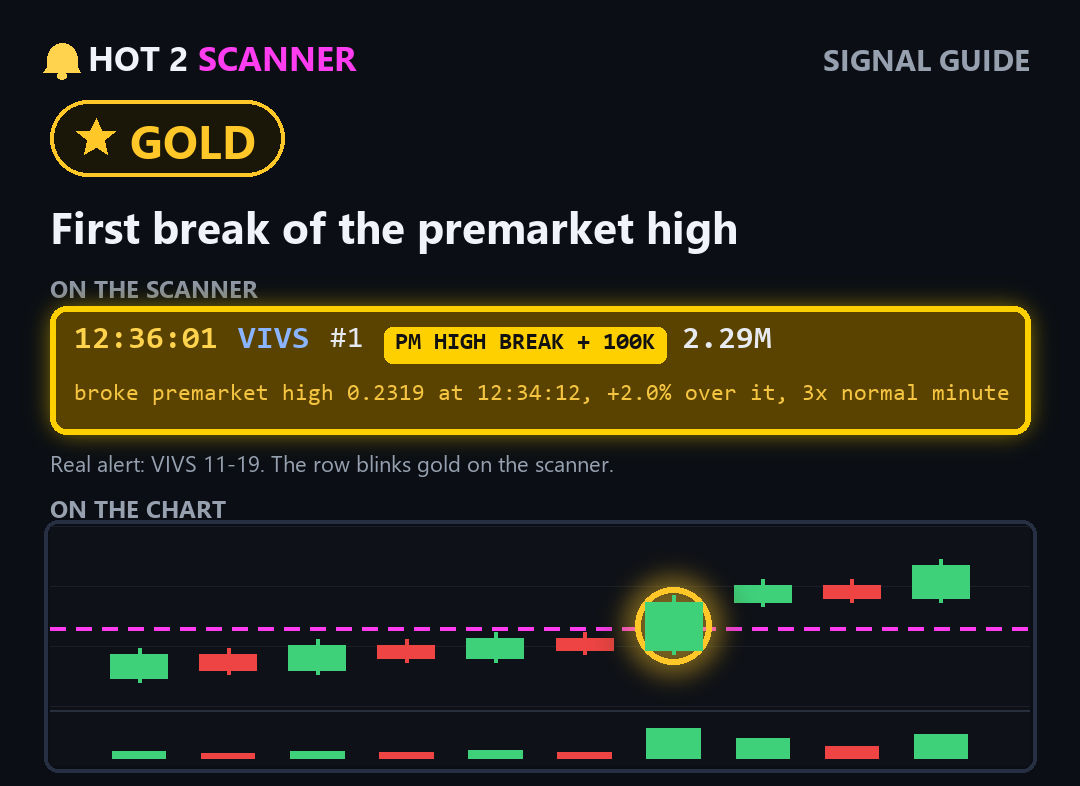
GOLD
First break of the premarket high
- WHAT IT IS
- The first break above today's premarket high (magenta) with 100,000+ shares trading in a minute.
- WHAT TO LOOK FOR
- Price clearing the magenta line, a big green volume bar, the gold star on the scanner.
- WHAT SOMETIMES HAPPENS
- It dips back to the line, holds it, and pushes again. VIVS later reached about $0.38.
- WHAT CAN GO WRONG
- It falls back under the line. POAS 11-12 ran to about $3.60, then slid back to $2.82.
- REAL EXAMPLE
- Real alert: VIVS 11-19. The row blinks gold on the scanner.
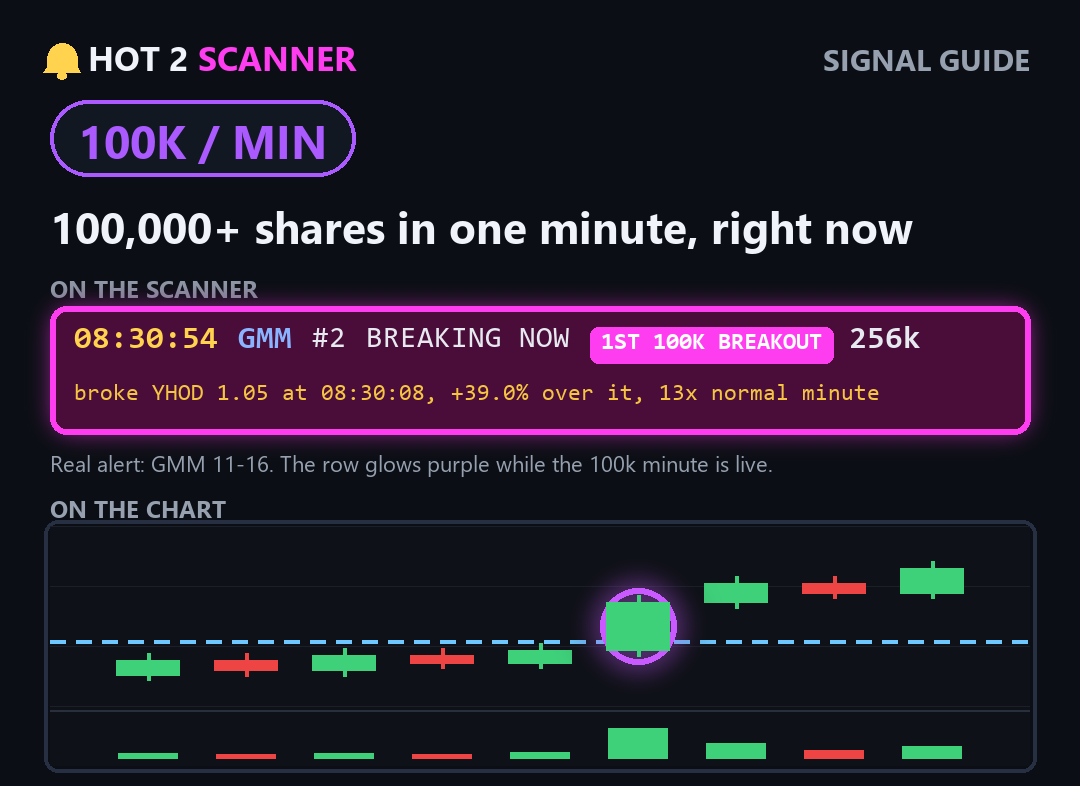
100K / MIN (purple)
100,000+ shares in one minute, right now
- WHAT IT IS
- The stock is trading 100,000+ shares in a single minute right now. The row glows purple.
- WHAT TO LOOK FOR
- The first 100k minute right at a breakout: the 1ST 100K BREAKOUT tag.
- WHAT SOMETIMES HAPPENS
- Buyers keep coming and the stock holds above the line it just broke.
- WHAT CAN GO WRONG
- It is a one-minute burst. When the 100k cools, the purple goes away and price can fade with it.
- REAL EXAMPLE
- Real alert: GMM 11-16. The row glows purple while the 100k minute is live.
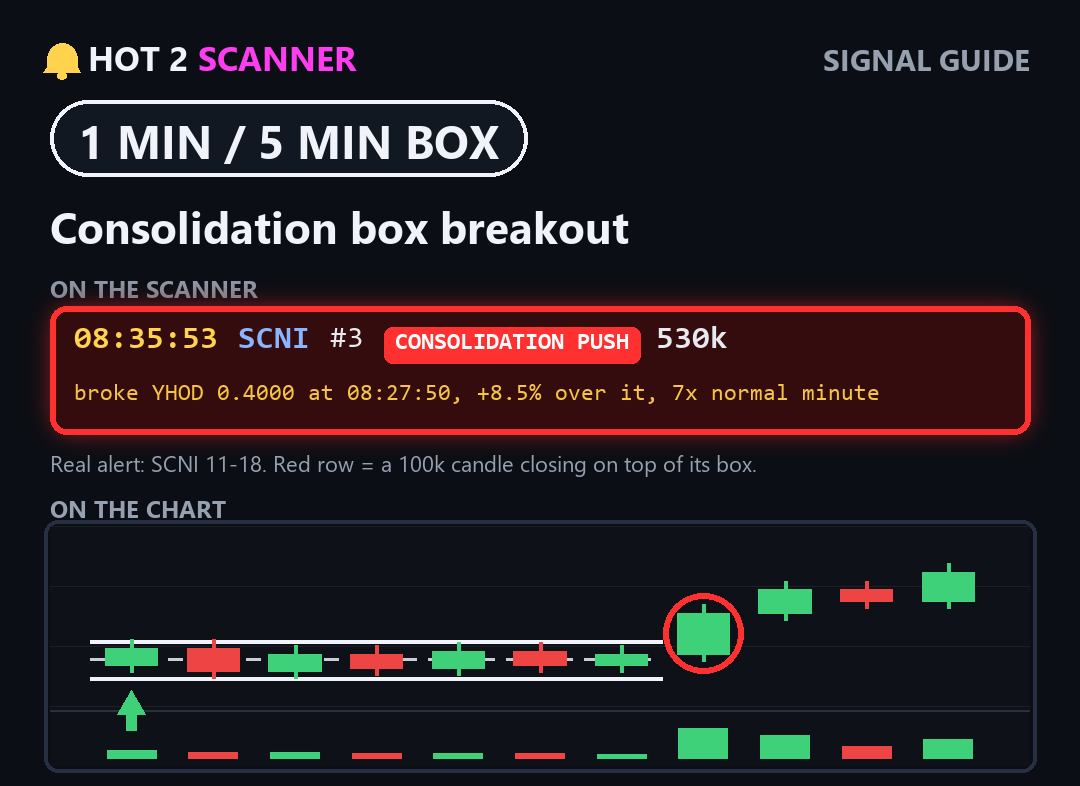
1 MIN / 5 MIN box breakout
Consolidation box breakout
- WHAT IT IS
- Price goes quiet in a tight range. The toolkit draws a white box; a green arrow marks a new coil.
- WHAT TO LOOK FOR
- Smaller candles inside the box, volume drying up, then a candle closing above the top line.
- WHAT SOMETIMES HAPPENS
- Price leaves the box and runs to the next line above.
- WHAT CAN GO WRONG
- It breaks out, spikes and falls back in. GMEX 11-12 hit $0.85 and gave it all back.
- REAL EXAMPLE
- Real alert: SCNI 11-18. Red row = a 100k candle closing on top of its box.
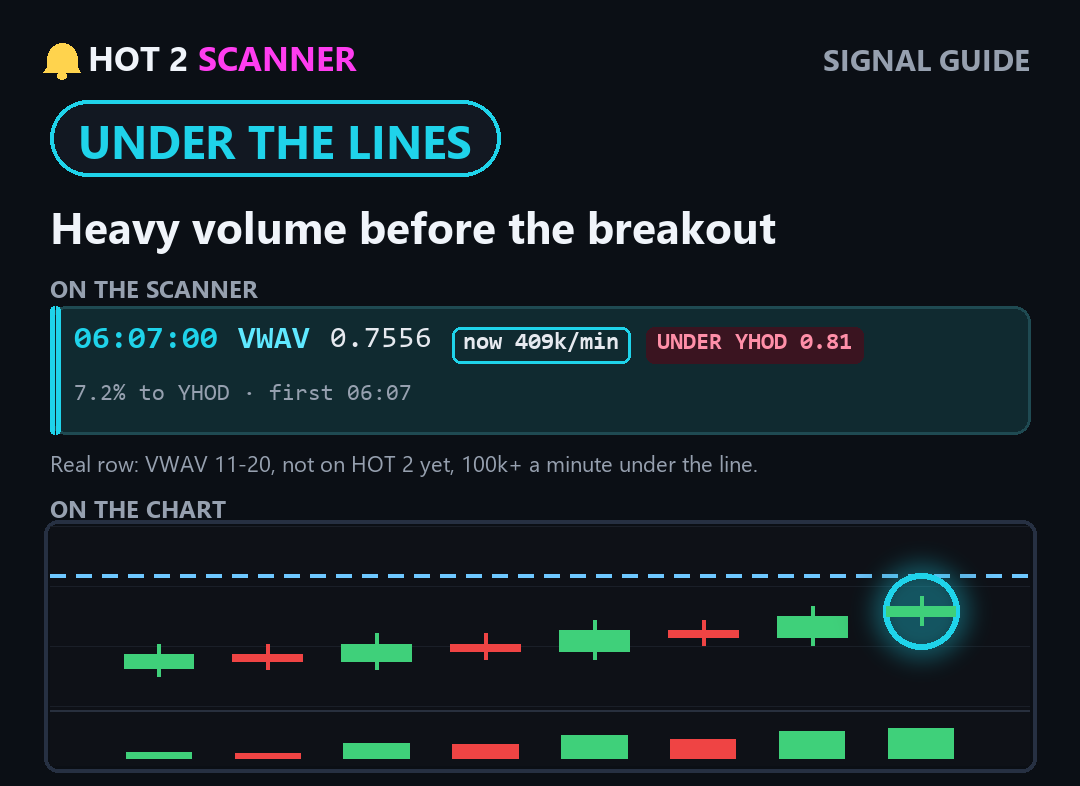
Under the lines
Heavy volume before the breakout
- WHAT IT IS
- Stocks NOT on HOT 2 yet doing 100k+ shares a minute while still UNDER YHOD (the premarket high after 9:30).
- WHAT TO LOOK FOR
- Volume building under the line, and how far it still has to go to reach it.
- WHAT SOMETIMES HAPPENS
- It reaches the line, breaks it, and shows up on HOT 2.
- WHAT CAN GO WRONG
- Volume dries up before it gets there. It is a watch list, not an alert.
- REAL EXAMPLE
- Real row: VWAV 11-20, not on HOT 2 yet, 100k+ a minute under the line.
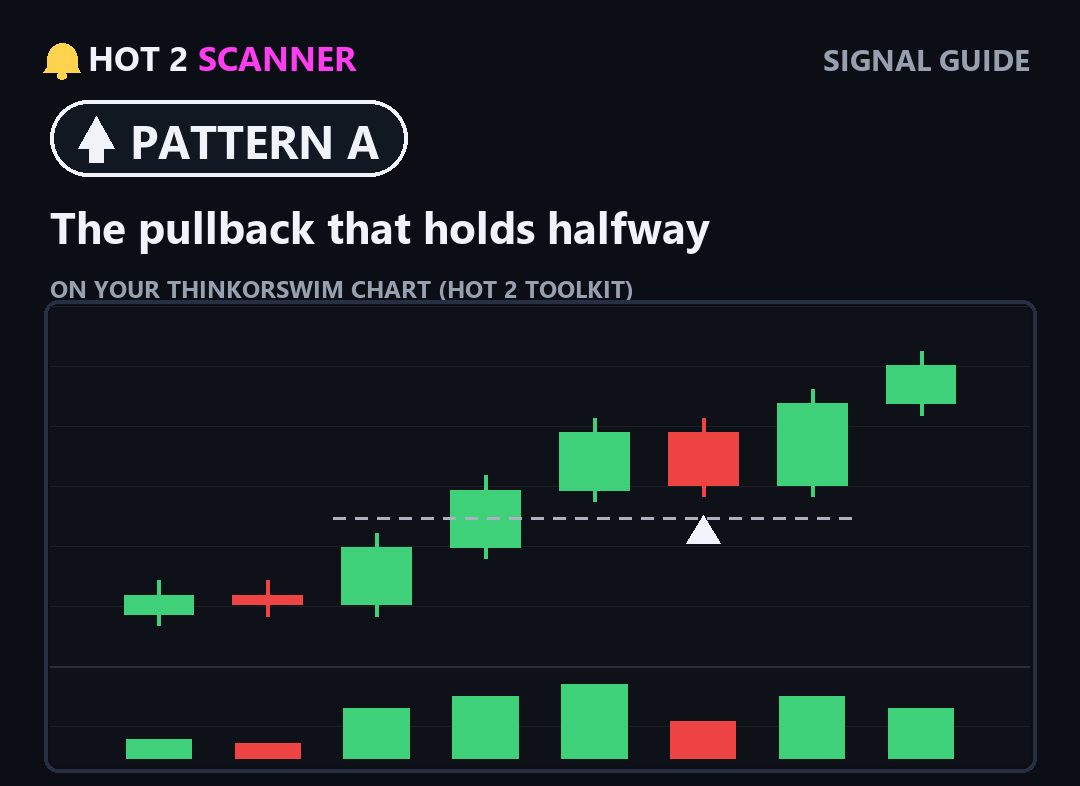
Pattern A
The pullback that holds halfway
- WHAT IT IS
- 2 or more green candles, then a red candle that holds the halfway line of that run. A white arrow marks it when the red candle closes.
- WHAT TO LOOK FOR
- Big arrow = above the line (YHOD / premarket high). Small arrow = still under it.
- WHAT SOMETIMES HAPPENS
- The pullback holds and the next green candle takes out the high.
- WHAT CAN GO WRONG
- The next candle breaks the halfway line and the run is over.
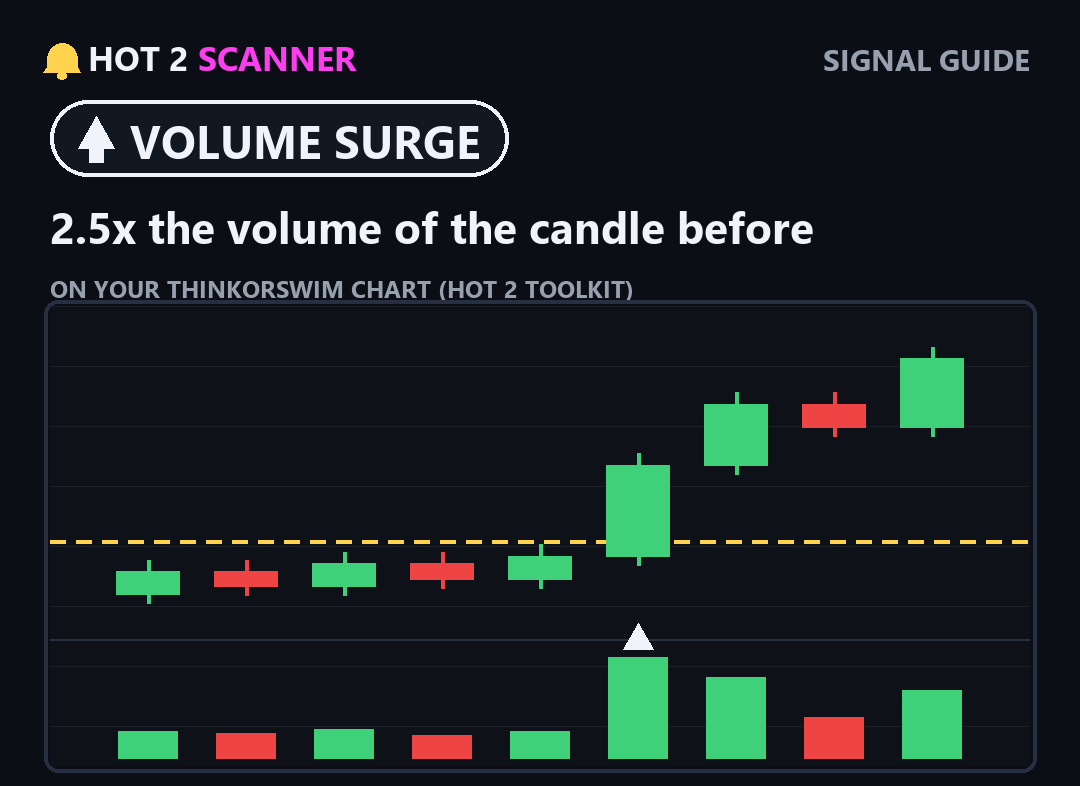
Volume surge
2.5x the volume of the candle before
- WHAT IT IS
- A white arrow in the volume pane: this candle traded 2.5x the volume of the one before.
- WHAT TO LOOK FOR
- The surge on a green candle that is breaking a line. Real money stepping in.
- WHAT SOMETIMES HAPPENS
- More big green bars follow and the move keeps going.
- WHAT CAN GO WRONG
- One huge bar and done: volume fades and price slides back.
Try the real scanner free, 15 minutes delayed. Members get it live, plus the thinkorswim toolkit.
Open the free scanner About the toolkit Full screen guide
Education, not financial advice. These signals describe what the scanner and toolkit show; they are not buy or sell recommendations. Signals fail often, and hot stocks move fast both ways. Real examples are shown because they are clear, not because they are typical. thinkorswim is a trademark of Charles Schwab; HOT 2 Scanner is not affiliated. © 2026 HOT 2 Scanner · Terms · support@hot2scanner.com